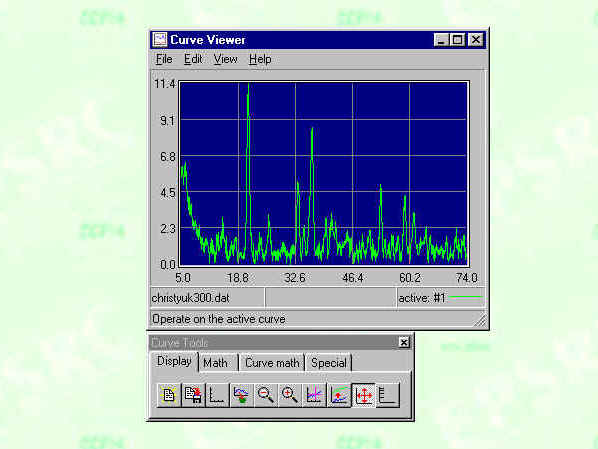
The saved output from the Plot Profile function of ImageJ contains values from 0 to whatever you selected as the end of the ROI. Here I've called the saved data up using Notepad (any word processor will do - just be certain to save it as an ASCII text file!) and deleted everything below 5.00 and above 74.00. This makes the two-theta range of the diffraction pattern 5-74 degrees.
There are still two problems with this data file:
1) the Y (intensity) values are incompatible with most diffraction software that is used to seeing thousands of counts/second
2) The X value intervals are non-uniform

Import the trimmed data into any curve viewer with a math function (Curve Viewer is available from Gerald Leatherman) as illustrated below.

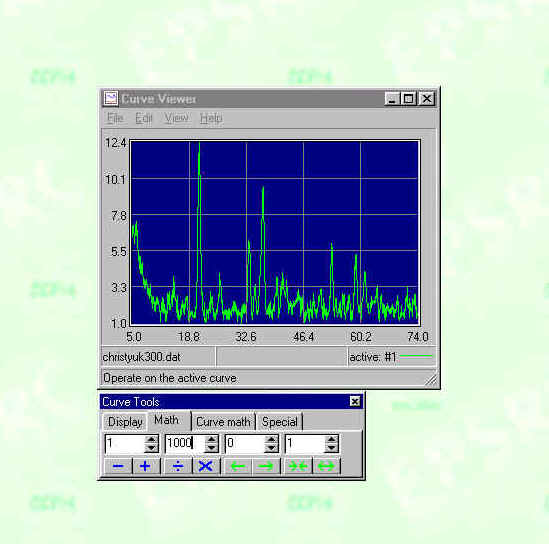
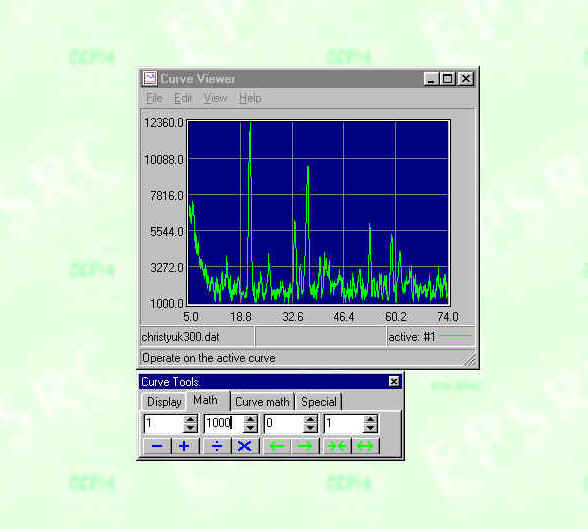
Add a value so that the function does not contain any 0 values (in this example 1) and then multiply by a reasonable factor (shown here 1000X).

This converts the data values to sums more readily understandable to diffraction programs as shown below

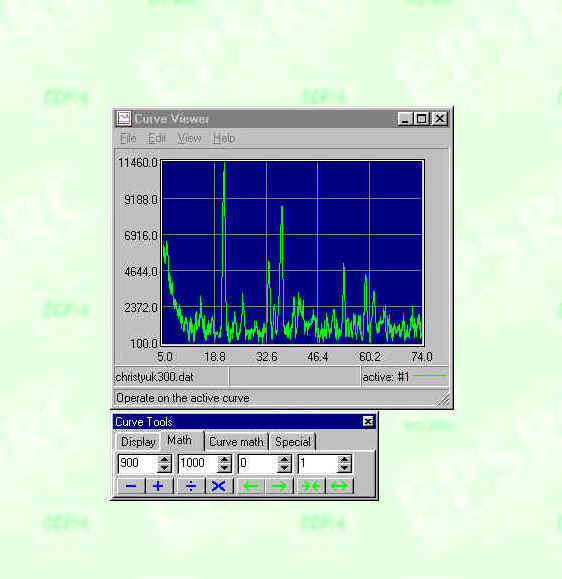
Since we have artificially introduced a large background, use the subtract function to remove most of it.

Save the converted file. The values are now comparable to diffraction databases as illustrated below
