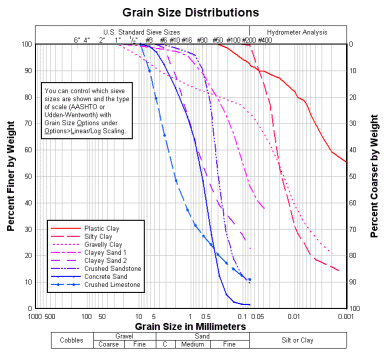
A grain size distribution plot is a special purpose graph generally used to depict the results of a sieve analysis, commonly known as a "gradation test". The sieve analysis determines the gradation (the distribution of aggregate particles, by size, within a given sample) in order to determine compliance with design, production control requirements, and verification specifications.
Typically a grain size distribution plot shows grain sizes in millimeters on the X axis with a reversed (largest-to-smallest) logarithmic scale:
DPlot shows material classifications below the X axis, using either the
AASHTO (American Association of State Highway and Transportation Officials)
designations or the Udden-Wentworth scale:
| AASHTO material designation | Udden-Wentworth scale | |||
| Size in millimeters | Size class | Size in millimeters | Size class | |
| 500 | Cobbles | 4096 | Boulder | |
| 76.2 | Coarse Gravel | 256 | Cobble | |
| 19.05 | Fine Gravel | 64 | Pebble | |
| 4.75 | Coarse Sand | 4 | Granule | |
| 2.0 | Medium Sand | 2.0 | Very Coarse Sand | |
| 0.425 | Fine Sand | 1.0 | Coarse Sand | |
| 0.075 | Silt or Clay | 0.5 | Medium Sand | |
| 0.25 | Fine Sand | |||
| 0.125 | Very Fine Sand | |||
| 0.0625 | Coarse Silt | |||
| 0.031 | Medium Silt | |||
| 0.0156 | Fine Silt | |||
| 0.0078 | Very Fine Silt | |||
| 0.0039 | Clay | |||
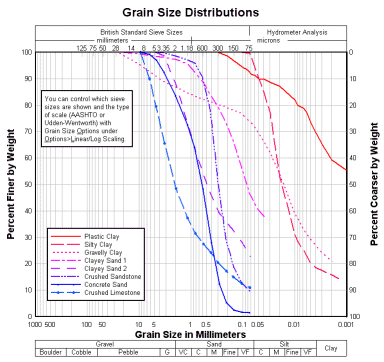
Sieve sizes are shown along the top of the graph using AASHTO-standard sizes as shown above, or British standard sieve sizes:
Privacy Policy

