GRAPH SOFTWARE FOR SCIENTISTS & ENGINEERS
Logarithmic Scale
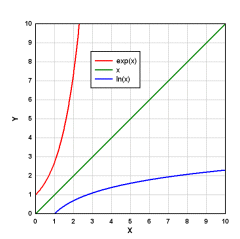
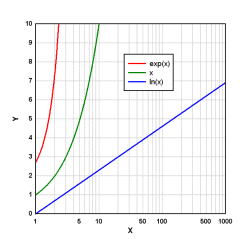
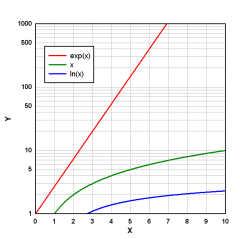
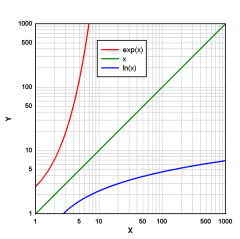
A logarithmic scale uses the logarithm of a physical quantity instead of the quantity itself. Presentation of data on a logarithmic
scale can be helpful when the data covers a large range of values; the logarithm reduces this to a more manageable range. The most common
form of logarithmic scale (which DPlot also uses) uses base 10 logarithms. The four graphs below show the same 3 curves using different
combinations of linear and logarithmic scaling: Y=exp(X), Y=X, and Y=ln(X).
Privacy Policy


