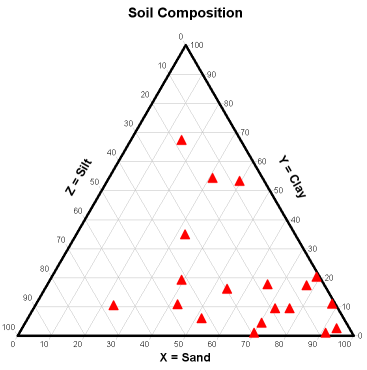
A triangle plot (also known as a ternary plot), is a graph of 3 variables. It is most often used in geologic studies to show the relative compositions of soils and rocks, but it can be more generally applied to any system of three variables.
The proportions of the three variables plotted always sum to some constant. In DPlot that constant is always the value 100. Because the 3 values for any point always sum to a constant, any one variable is not independent of the others so only two variables must be known.
Each vertex of the triangle represents a 100% proportion of the variable to the left, and 0% of the variable to the right side of the vertex.
As a proportion increases in any one variable, the point representing that sample moves from the base to the opposite point of the triangle.
In DPlot the X values are used for the horizontal scale, Y values are used for the right side of the triangle, and Z values (left side of the
triangle) are forced to 100-X-Y.
54.5,15.6 39.4,18.8 79.0,19.8 91.2,0.59 15.4,66.8 23.5,9.93 39.6,52.7 32.6,34.3 88.3,10.5 31.0,53.8 51.9,5.47 76.5,8.87 65.7,17.1 70.6,4.03 93.9,2.04 42.3,10.4 77.4,16.8 70.0,0.60 72.1,8.91 |
 |
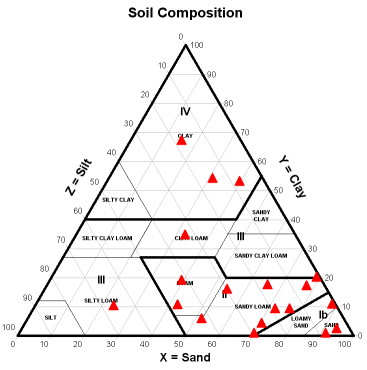
| If your data is composed of sand and clay percentages from a soil texture analysis (with the third implied axis being silt percentage), then you may desire to display the graph using the USDA soil classifications. This option divides the graph into the 12 regions of USDA-specified soil textures and labels each region. To use this option, right-click on the graph and select "USDA Soil Classifications" from the drop-down menu. |  |
If your data is sand, clay, and/or silt percentages but is not ordered correctly for this plot, you can perform one or two simple swapping operations such that the graph will have the correct orientation for this option.
| If your data is arranged as | Perform these operations | |
| X=Sand | Y=Silt | Edit>Operate on Y with Y=100-(X+Y) |
| X=Clay | Y=Sand | Edit>Swap X,Y |
| X=Clay | Y=Silt | Edit>Swap X,Y Edit>Operate on X with X=100-(X+Y) |
| X=Silt | Y=Clay | Edit>Operate on X with X=100-(X+Y) |
| X=Silt | Y=Sand | Edit>Swap X,Y Edit>Operate on Y with Y=100-(X+Y) |
Privacy Policy