SCA, SCALE


NAME
SCA, SCALE - select hydrophobicity scale.

SYNOPSIS
SCA keyword
SCALE keyword

DESCRIPTION
The command SCALE selects the specified hydrophobicity scale. At present, three scales are available: Eisenberg normalized consensus scale, Kyte-Doolittle hydropathy scale and White octanol scale (experimental). The scale is assigned to the structure which is currently being handled (the structure which was caught using the command CATCH). It is also used as default hydrophobicity scale for the sequence in the main sequence buffer. The hydrophobicity scale is used to calculate the averaged hydrophobicity and hydrophobic moment. It may be also used to color the protein structure according to hydrophobicity.

Hard-coded program default is Eisenberg scale.

KEYWORDS
KEYWORD
(SHORT)
KEYWORD
(LONG)
DESCRIPTION
EIS EISENBERG Use Eisenberg normalized consensus hydrophobicity scale.
KD KD Use Kyte-Doolittle hydropathicity scale.
WHI WHITE Use octanol scale (Steven White group, experimental data).

HYDROPHOBICITY SCALES
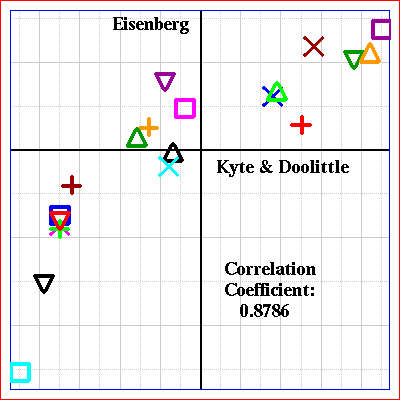
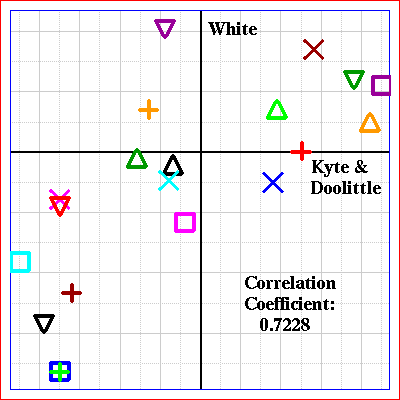
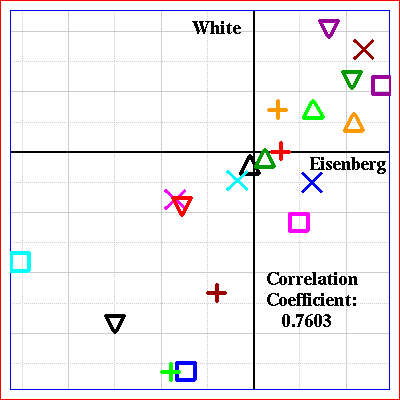
The table below contains numeric data for three hydrophobicity scales which are used in garlic. Correlation coefficients and plots are also given. The original White octanol scale contains free energy changes for a transfer of whole residues from water to octanol. In garlic, these free energy changes are multiplied by minus one and used as hydrophobicity values. The experimental values and nice theoretical explanations may be found at:
http://blanco.biomol.uci.edu/hydrophobicity_scales.html
NAME EIS KD WHI
ALA 0.62 1.80 -0.50
ARG -2.53 -4.50 -1.81
ASN -0.78 -3.50 -0.85
ASP -0.90 -3.50 -3.64
CYS 0.29 2.50 0.02
GLN -0.85 -3.50 -0.77
GLU -0.74 -3.50 -3.63
GLY 0.48 -0.40 -1.15
HIS -0.40 -3.20 -2.33
ILE 1.38 4.50 1.12
LEU 1.06 3.80 1.25
LYS -1.50 -3.90 -2.80
MET 0.64 1.90 0.67
PHE 1.19 2.80 1.71
PRO 0.12 -1.60 -0.14
SER -0.18 -0.80 -0.46
THR -0.05 -0.70 -0.25
TRP 0.81 -0.90 2.09
TYR 0.26 -1.30 0.71
VAL 1.08 4.20 0.46
ASX -0.84 -3.50 -2.25
GLX -0.80 -3.50 -2.20
UNK 0.00 -0.49 -0.52


EXAMPLES
COMMAND DESCRIPTION
sca eis
Use the scale made by David Eisenberg.
sca whi Use the experimental scale made
by Steven White and coworkers.

NOTES
(1) Many hydrophobicity scales may be found in literature. However, most of these scales are mutually highly correlated. If you are interested in these correlations, try the web server SCACOR . All you have to do is to select two scales for comparison. The web server will calculate the correlation factor and prepare the scatter plot.

RELATED COMMANDS
PLOT is used to draw averaged hydrophobicity and hydrophobic moment. COLOR HYPHOB is used to color the structure according to hydrophobicity of residues.

REFERENCES
(1) Kyte, J. and Doolittle, R. F. (1982). J. Mol. Biol. 157, p. 105.
(2) Eisenberg, D., Schwarz, E., Komaromy, M. and Wall, R. (1984). J. Mol. Biol. 179, p. 125.
(3) Wimley, W. C. and White, S. H. (1996). Nature Struct. Biol. 3, p. 842.
(4) Wimley, W. C., Creamer, T. P. and White, S. H. (1996). Biochemistry 35, p. 5109.
(5) White, S. H. and Wimley, W. C. (1998). Biochim. Biophys. Acta 1376, p 339.
(6) White, S. H. and Wimley, W. C. (1999). Annu. Rev. Biophys. Biomol. Struc. 28, p. 319.