Acta Cryst. (1967). 22, 151-152.
H. M. Rietveld,
Reactor Centrum Nederland,
Petten, The Netherlands
Received 28 July 1966
Abstract
A structure refinement procedure is described, which obtains a least-squares fit between the calculated and observed intensities measured at equal angular intervals on a neutron powder-diffractometer. It is shown that the structure parameters are significantly more reliable than those determined by a method using the integrated intensities of overlapping peaks.
While the structure determination from a well resolved powder diffraction diagram often proves to be quite feasible, the inherent presence of overlapping reflections generally prevents the full use of the available information to refine the structural parameters. An obvious solution is to include as observed data in the least-squares refinement the integrated intensities of the composite diffraction peaks (Rietveld, 1966). A major drawback of such a procedure, however, is the fact that any detail in the profiles of these peaks is lost.
In the case of neutron diffraction, a more direct method to solve this
problem was found when it appeared that the peak shapes of the single
diffraction peaks obtained from the powder-diffractometer at Petten
were Gaussian. The profile of a composite peak can then be regarded as
the sum total of the constituent Gaussian peaks representing the individual
Bragg reflections. The contributions of each of these constituent peaks to
the enveloping peak at position ![]() can be written as
can be written as
![]() .
.
The quantities b and ![]() in this expression, being respectively
the full width at half height (halfwidth) and the position of the peak, can
be obtained from an inspection of the diffraction diagram, the unit-cell
parameters and the wavelength. The remaining quantity a is then the only
unknown. It is proportional to
in this expression, being respectively
the full width at half height (halfwidth) and the position of the peak, can
be obtained from an inspection of the diffraction diagram, the unit-cell
parameters and the wavelength. The remaining quantity a is then the only
unknown. It is proportional to ![]() , where j is the multiplicity of the
structure factor F, the precise relation being as follows.
, where j is the multiplicity of the
structure factor F, the precise relation being as follows.
Equating the area of the Gauss curve to the integrated intensity gives
![]()
from which
![]()
Substituting
![]()
gives ![]() , where c'
represents an overall scale factor.
, where c'
represents an overall scale factor.

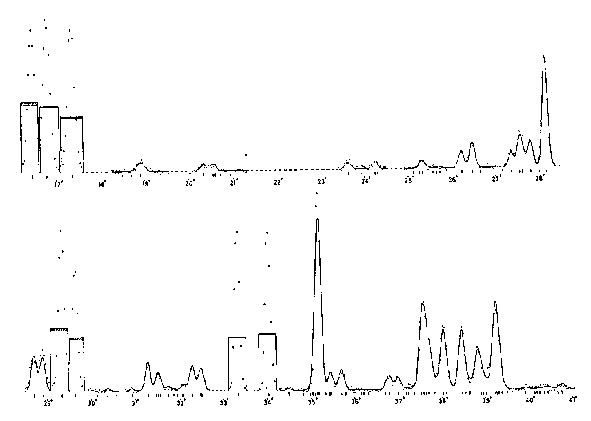
Fig. 1.
Neutron powder diffraction diagram of ![]() (intensity
vs
(intensity
vs ![]() ).
The solid line indicates the calculated profile and
the dots the measured intensities. The rectangles represent the
integrated single-peak intensities, their different heights
the agreement between calculated and observed values.
).
The solid line indicates the calculated profile and
the dots the measured intensities. The rectangles represent the
integrated single-peak intensities, their different heights
the agreement between calculated and observed values.
Finally, putting
![]()
where ![]() is a measure of the contribution of structure
factor
is a measure of the contribution of structure
factor ![]() at position
at position ![]() to the intensity measured at
position
to the intensity measured at
position ![]() , and corrected for background, we can say that
, and corrected for background, we can say that
![]()
The summation is taken over all reflections ![]() which can contribute
significantly to
which can contribute
significantly to ![]() ; the effective range of a Gaussian peak
for this purpose is set at three times its halfwidth.
; the effective range of a Gaussian peak
for this purpose is set at three times its halfwidth.
In addition, the well resolved peaks are replaced by a ![]() peak, i.e.
all
peak, i.e.
all ![]() 's in this range are replaced by zero's except for one value
which is made equal to the area of the Gaussian peak and
's in this range are replaced by zero's except for one value
which is made equal to the area of the Gaussian peak and
![]()
This procedure eliminates the (now unnecessary) introduction of an uncertainty due to the supposition of the idealized Gaussian peak shape.
To test the method the structure of ![]() (Loopstra & Boldrini, 1966)
was refined. It was found that the standard deviation of the least-squares
(Loopstra & Boldrini, 1966)
was refined. It was found that the standard deviation of the least-squares
parameters improved by an average factor 2.3, compared with those obtained by the method of overlapping reflections (Rietveld, 1966). Fig. 1 shows the final agreement between calculated and observed values. The dots represent the intensities, measured at each step by the proportional counter and corrected for background, and the full line the calculated profile. The different heights of the rectangles representing the integrated intensities indicate the agreement between those values.
* Work supported jointly by Reactor Centrum Nederland and Institutt for Atomenergi, Kjeller, Norway.