Luca Lutterotti1, Riccardo Ceccato1, Roberto Dal Maschio1 and Eva Pagani2
1Dipartimento di Ingegneria dei Materiali, Universita' di Trento
via Mesiano,77 - 38050 Mesiano, Trento, Italy.
2Maffei S.p.a.
via Maccani, 112 - 38100 Trento, Italy.
(*) This paper has been presented at the EPDIC V, Parma 1997, and will be published on Material Science Forum.
Keywords: Silica-Glass, XRD, Rietveld Method, Quantitative Analysis, AmorphousAbstract. The modelling of silica glass, following the work of Le Bail [1], has been introduced in a Rietveld general procedure developed for quantitative phase analysis. The method approximates the amorphous phase as a nanocrystalline solid where the long-range order is lost. As pointed out by the same author, the model is not sufficient to describe exactly the amorphous structure. Moreover, from a fitting point of view, it provides nearly the same results as those obtained by reverse Monte Carlo simulation (RMC). This study shows how this approach can be successfully used to determine the amorphous fraction in ceramic materials containing a glassy phase. The crystal structure of silica, as determined by Le Bail [1], has been used, whereas the nanocrystalline behaviour is obtained using the line-broadening theory reported in [2] with a crystallite size of about one cell. The method has been tested on synthetic mixtures and ceramic-ware materials using X-ray diffraction. It provides an accurate, fast and standardless method of analysis suitable for quality and research controls. Other amorphous phases can be analysed providing a crystal structure model previously refined on a sufficiently pure sample.
1 Introduction
The quantitative analysis of the amorphous/crystalline fraction is one of the most investigated and frustrating challenge in the diffraction research. In the traditional ceramic field it is well known as the amorphous fraction, and in particular the silicate glass content, influences the thermomechanical properties of the manufacts.
As a particular example in the sanitary ware field, where silicate raw materials are used, it is very important to assess the product quality by a check on the amorphous silica content.
Many methods have been proposed to analyse the quantity of amorphous phase, but at the present no one satisfy all the requisites needed to make a method eligible for industrial quality control and certification. Some of these requisites are: a) good accuracy, precision and reproducibility; b) easy of use; c) fast and possibly automatic mode of operation; d) non-destructive and applicability to powder or bulk; e) non subjective or operator independent; f) applicability to different systems.
Unfortunately the methods developed until now are restricted to the research laboratory use because of their lack in some of these requirements. Principally they are limited to very few specialists or are based on an external/internal standard suffering for subjective interpretation or not general applicability (in particular to bulk specimens). In the pure crystalline field the Rietveld method is growing thanks to its accuracy and general applicability and to the increased availability of friendly programs in the last few years. Some people have tried to extend his use to samples containing amorphous structures, by internal standard [3] or external [4, 5] standard, on the hope to improve the accuracy and precision of pre-existing methods. It is clear that a further improvement can be done if we can use the Rietveld method treating the amorphous phase like a crystalline one. In this case we can benefit of all the good features of this method and principally to avoid the need of an external or internal standard.
Recently Le Bail has published the refinement of the silica glass structure adopting a particular Rietveld program and a nanocrystalline model. One of his conclusions was that from a fitting point of view it is impossible to distinguish between a good nanocrystalline model and a completely amorphous structure simulated by RMC methods. The first suggestion that come from his work is that, given an amorphous phase, his structure can be approximated quite well starting from one of his crystalline polymorphs if available. When we refer to good approximation of the structure we mean that the diffraction spectrum coming from this nanocrystalline structure reproduces the experimental one with good approximation.
Starting from this work we have tried to utilise this nanocrystalline concept in the quantitative analysis by the Rietveld method considering this amorphous structure as one of the crystalline phases. The details of the methodology employed and the results of the analyses of ad hoc prepared samples as well as of real materials are given. After assessment of the general procedure, this methodology was included in a user friendly program operating in semiautomatic mode.
2 Experimental
Three different sets of samples were analysed:
a) silica/alumina synthetic samples prepared mixing silica glass (SiO2 = 98.5 wt %, MgO, Na2O) powdered by ball-milling and crystalline a-alumina (ALCOA CT3000SG: Al2O3 > 99.8 wt %, 0.08 wt % Na2O, 0.03 wt % SiO2) in various weight ratios;
b) an electro-melted refractory material (ER 1681, Refradige S.p.A.) with a known weight composition: Al2O3 = 47 %, ZrO2 = 32 %, SiO2 = 21 %;
c) sanitary-ware samples (Ceramica Dolomite S.p.A.) with an unknown content of amorphous phase.
Spectra were collected on both a Rigaku D-MAX diffractometer using Cu Ka radiation with a graphite monochromator in the diffracted beam and a Philips X Change instrument Ni filtered. For the silica glass-alumina samples scans were conducted with the Rigaku goniometer over a 5-102 degrees 2q range with 0.05 degrees as sampling interval and 12 s as fixed time. Divergence and scattering slits of 1/6 degrees were selected to ensure the illumination condition for the samples at low angle. The spectrum for the sample b) was collected with the Philips instrument. One of the samples c) was analysed both with the monochromatised instrument and the filtered one to study the background influence on the quantitative result.
All the spectra were refined by the Rietquan program [6]; this is a Rietveld like software developed for quantitative analysis running under the WindowsTM environment. It is a CIF compliant program whose principal characteristics are the easy to use interface with a simple database of structures and the possibility to refine the spectrum in automatic mode. This means simply that the refinement strategy is conducted by the program without the interposition of the operator which decides only the number and type of phases present in the sample.
3 Theoretical model
Modelling of the silica glass structure. In 1995 Le Bail [1] has shown how it is possible to model the silica glass using the simple a-Carnegieite structure proposed by Barth in 1932 [7]. The assumption was that from a diffraction point of view it is not possible to distinguish if the silica glass is a completely amorphous phase or a nanocrystalline structure.
The basic idea was to refine the Carnegieite structure and an orthorhombic variation using a Rietveld program adapted to this aim. By combined fitting of neutron and X-ray diffraction data he found the structure reported in Table 1 [1]. The short range order is provided by the crystal structure and it is assumed that the long range order is lost by a nanocrystalline structure. This is equivalent to use very large peaks in the refinement by suitable parameter values in the Caglioti formula as Le Bail did. The very low Rp values obtained (2.64 % for the Carnegieite structure and 2.45 % for the orthorhombic) justify the goodness of the model that cannot be improved significantly by using a real amorphous structure.
Quantitative approach. Starting from the demonstration that the nanocrystalline structure for silica glass is a good approximation of the real one, we can apply the procedure to quantitative phase analysis using the scale factor of the glass in the formulas. This last assumption will be verified later in the work.
In particular we have used a Rietveld procedure basically described in [2]; the principal difference respect to the traditional powder refinement program is that the line broadening characteristics are computed from the crystallite size and r.m.s. microstrain instead of the classical Caglioti formula [8]. Then, to simulate an amorphous diffraction pattern by the nanocrystalline model we can just suppose that the crystallites are of the same order of the cell. More exactly the crystallite value can be regarded as the limit between short and long range order. The r.m.s. microstrain is consequently not considered for the amorphous structure and set to zero.
At this point, having a sample with N phases, the fraction of the phase i, crystalline or amorphous, can be computed from the scale factors as refined by the program:
![]() (1)
(1)
where w is the weight fraction; I designs the scale factor, r the density and t the absorption contrast effect [9, 10]; the subscript refers to the phase as index.
A modelling of the thermal diffuse scattering was not employed because its use or not was found of negligible influence on the quantitative phase analysis and doesn't improve significantly the fitting. The major effect is an increase in the computing time and for this reason was avoided.
|
|
|
|
|
|
|
|
|
|
|
|
|
|
|
|
|
|
|
|
|
|
|
|
|
|
|
Table 1: Refinement of the silica glass nanocrystalline structure (Cubic, P213) and comparison with the one refined by Le Bail [1].
4 Results and discussion
The method was initially applied to samples prepared mixing known proportions of a crystalline phase (a pure a-Al2O3) and a silica glass as described in the experimental section. First of all the pure amorphous sample and the completely crystalline phase were refined to check the available structure models. The corundum crystal structure was found nearly the same as that reported in the literature [2] and the result of the refinement of our silica glass nanocrystalline structure is reported in the table 1 along with the results of Le Bail [1]. It is surprising how this refinement give the same result of the Le Bail one though the poor quality of our data compared to his work. This is one constant characteristic of this model; the silica glass model is very sensible to the diffraction spectra and especially the Carnegieite structure donÕt require a wide d-range for his determination if starting from an already tested model. In the rest of the work we decided to use only the cubic model that with our range of data give practically the same fitting results as the more complicated orthorhombic one.

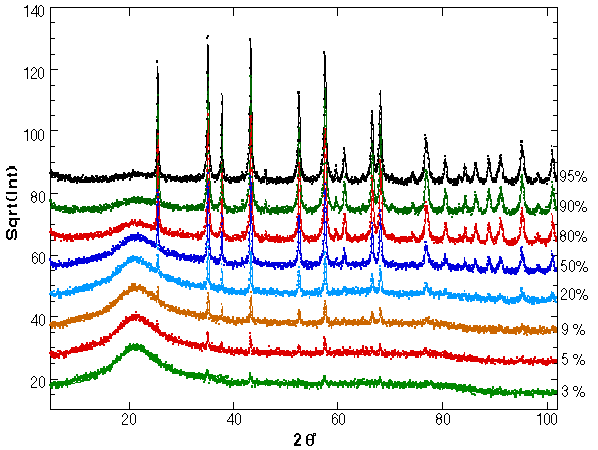
Figure 1: XRD spectra for the mixed silica-corundum samples as fitted by the program. On the right hand the corundum percentage is reported.

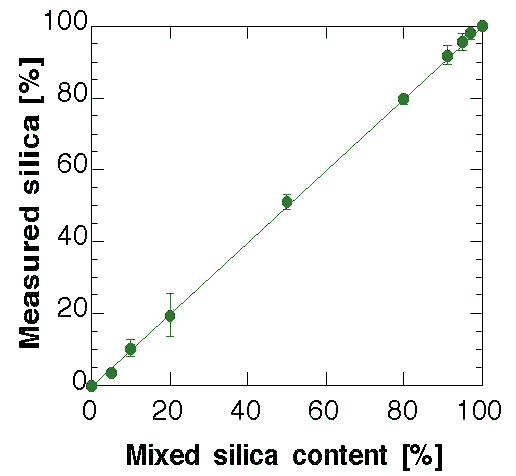
Figure 2: Comparison between the mixed and computed silica glass fractions by the method.
|
|
|
|
|
|
|
|
|
|
|
|
|
|
|
|
|
|
|
|
|
|
|
|
|
|
|
Table 2: Analysis data used to construct Fig. 2.
In Fig. 1 the refinement of all samples is reported. The data are plotted on a squared scale to put more evidence on the amorphous phase and small peaks, having also the same statistical deviations on the top of the reflexes and on the background.
The results of the quantitative analysis on all samples are presented in Fig. 2 along with Table 2 for the numerical values. At this point it is clear that the nanocrystalline model give the correct results for the quantitative analysis and it proves to be surprisingly accurate. Some analyses have been added to the original scheduled program to test the sensibility of the method in the amorphous-rich and crystalline-rich regions. With the present model and phases the 3 wt.% of crystalline content and the 5 wt.% of silica glass has been found as a practical limit to the quantitative analysis. In any case they are far beyond any alternative procedure and probably can be improved by a better measurement and/or a more accurate amorphous structure. For the low silica content a treatment of the TDS can be helpful.
Real samples were analysed using the automatic mode of operation of the program. In this case the refinement procedure and strategy is implemented in the code and the operator decide only when to start the analysis and the phases present in the sample. This procedure was builded uniquely for quantitative analysis and the structure of the phases is not refined assuming that it is well known.
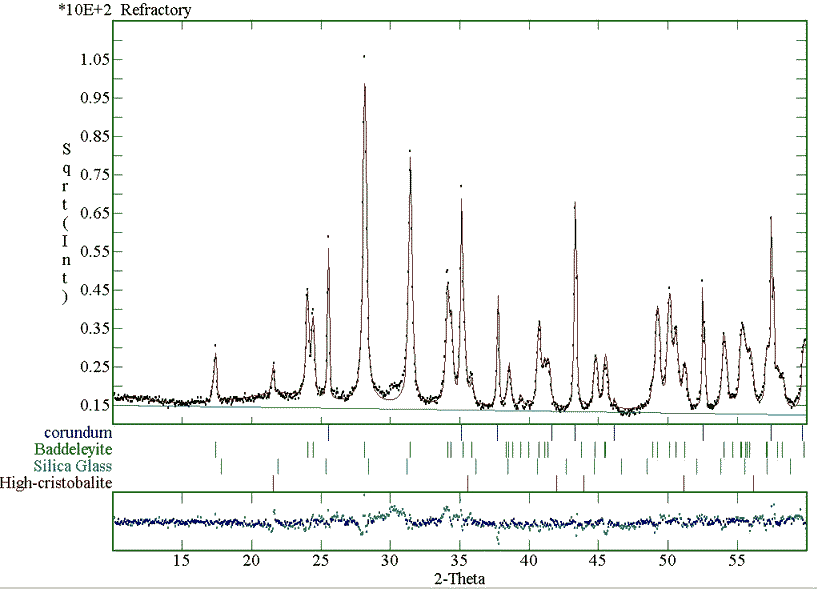
The final fitting of the sanitary ware sample measured with the monochromatised instrument is plotted in Fig. 3. The phase fractions for this sample and the refractory material are given in Table 3. Again the method proves to be successful also in the case of more than one crystalline phase and of bulk industrial samples.

Figure 3: Fitting of the sanitary ware XRD pattern, collected using a monochromatised instrument, for the quantitative analysis.
|
|
|
||
|
|
|
|
|
|
|
|
|
|
|
|
|
|
|
|
|
|
|
|
|
|
|
|
|
|
|
|
|
|
|
|
|
|
|
Table 3: Quantitative analysis of the sanitary-ware sample using a monochromatised and a Ni-filtered intrument and of the refractory material.
Two notes must be recalled at this point; first, we want to investigate the influence of the background on the analyses. In all cases we have used a linear background to avoid correlations. The analysis of the c) sample has been performed both on a data set coming from a monochromatised diffraction instrument (low background, see Fig. 3) and on one coming from a Ni-filtered device (high background). Again the analysis is nearly the same as visible in Table 3. The second advice regards the nature of the silicate glass. Silica glass may contain others elements that in principle can alter the analysis. For example aluminium is often present in such samples up to 9-10 at. %. By analysis of several samples not reported for brevity here, we have not found significative deviations from the reported Carnegieite structure. Furthermore we have to consider that in the quantitative analysis the overall intensity area is important and this is proportional to the "electron density" and bulk density of the amorphous phase. This means that the accuracy of the analysis is proportional principally to the accuracy of the estimation of the amorphous chemical composition and cell volume, the structure having an influence of the second order. In the case of aluminium this atom shows a number of electrons, and then an X-ray scattering factor, close to the silicon reducing in practice the possible error of a wrong chemical estimation near to a practical zero.
The procedure can be applied virtually to any type of amorphous content; we have presented here the case of silicate glass but any amorphous phase can be used in the procedure after identifying or refining its "nanocrystalline structure" approximation as was done for the crystalline compounds in the past and presently [1].
Acknowledgement
We would like to thank Dr. R. Ioriatti for the help in the analysis of the sanitary ware and sample preparation.
References
[1] Le Bail, A., J. Non-Cryst. Solids, 183, pp. 39-42, 1995.
[2] Lutterotti, L. and Scardi, P., J. Appl. Cryst., 23, pp. 246-252, 1990.
[3] Bish, D. L. and Howard, S. A., J. Appl. Cryst., 21, pp. 86-91, 1988.
[4] Jordan, B., O'Connor, B. H. and Deyu, L., Powder Diffr., 5 [2], pp. 64-69, 1990.
[5] O'Connor, B. H. and Raven, M. D., Powder Diffr., 3, pp. 2-6, 1988.
[6] Lutterotti, L., unpublished work, 1996.
[7] Barth, T. F. W. and Posnjak, E., Z. Kristallogr., 81, 376, 1932.
[8] Caglioti, G., Paoletti, A. and Ricci, F. P., Nucl. Instrum. Methods, 3, pp. 223-228, 1958.
[9] Brindley, G. W., Philos. Mag., 36, pp. 347-369, 1945.
[10] Taylor, J. C. and Matulis, C. E., J. Appl. Cryst., 24, pp. 14-17, 1991.

© 1997 Luca Lutterotti