X-Ray is a standard MDI (multiple document interface)
windows application running on PC equipped with windows 95 (or 98) or windows
NT.
Let's discover it on the following screens :
X-Ray includes classical image processing and graphics function. An image (usually from an image plate reader) can be opened in a child window. Specific and usual image formats are accepted. Contrast, zoom, position,... can be modified.

For the analysis of such obtained pattern, we always need to know with good precision the position of the incident beam, in order to transform positions on image towards Bragg spacings. In addition to a manual adjustment, X-Ray uses the Hough algorithm to automatically solve this pattern recognition problem.

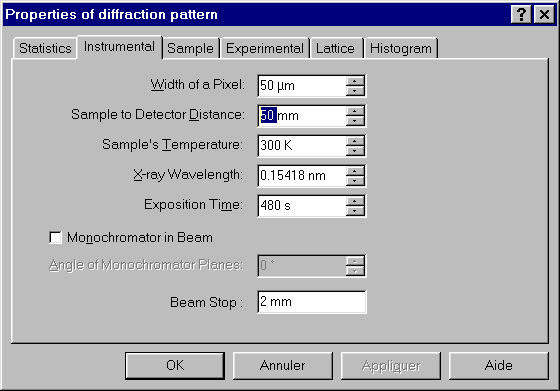
The software allows to introduce various parameters (instrumental, experimental,...). In the present example, we want to calibrate the sample to detector distance using the diffractions of benzoïc acid. We firstly put an approximate value of 50 mm.
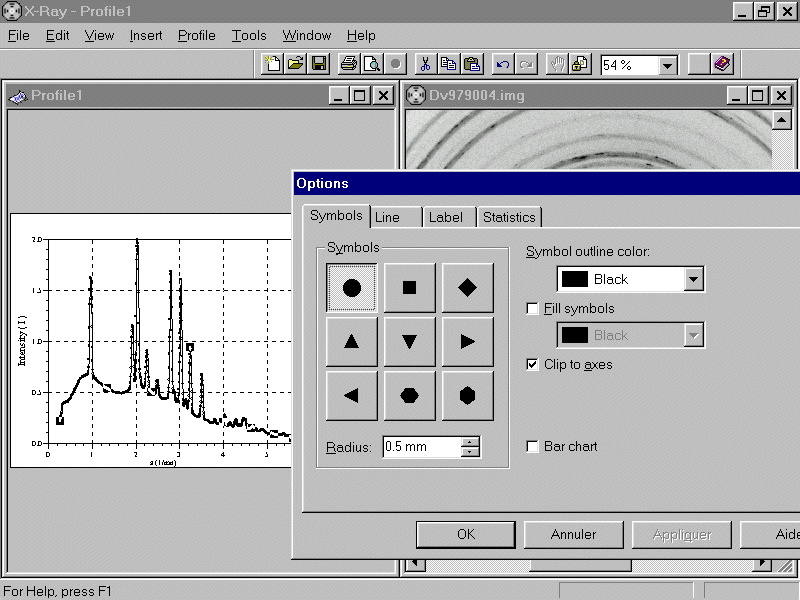
It is possible to integrate the intensities and to obtain a profile as a function of the scattering vector norm (using the 50 mm approximate distance). The software has tools to represent graphs of xy data and some options can be choosen to visualize data.
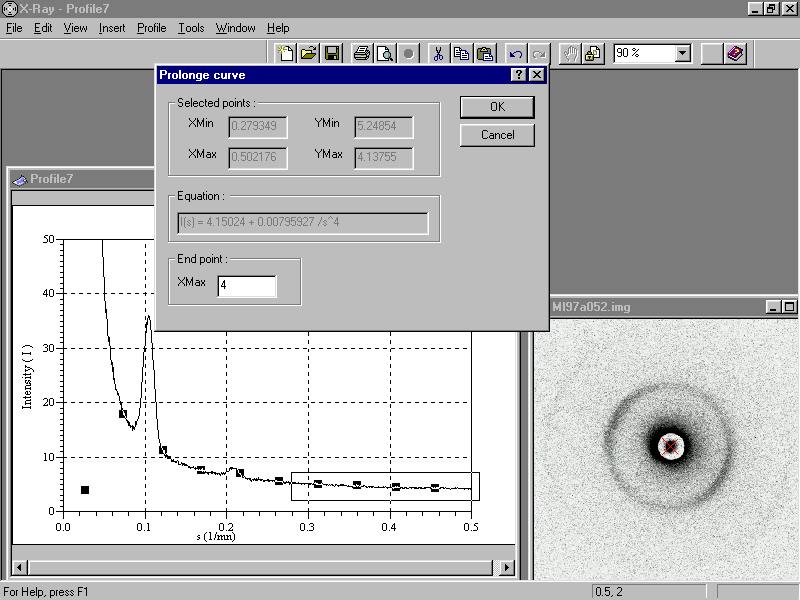
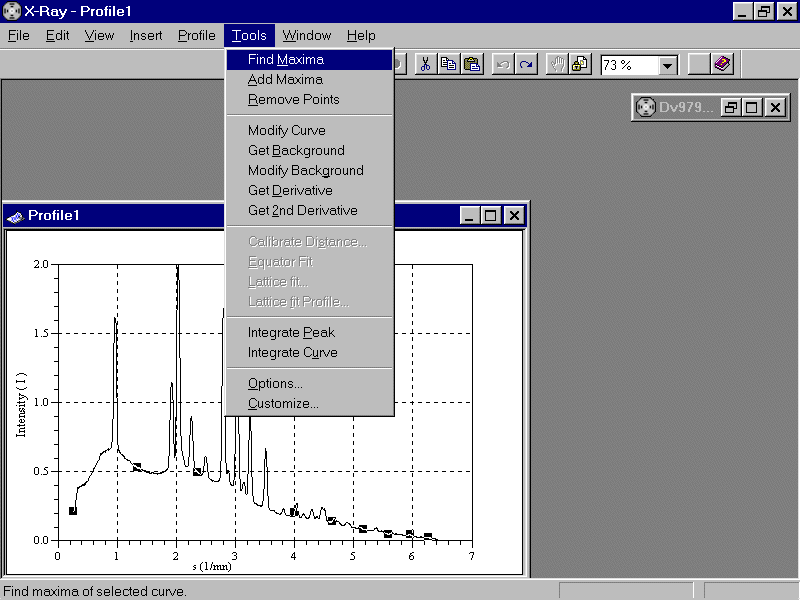
Among the tools available for the profile analysis, it is possible to automatically find, add or remove maxima.
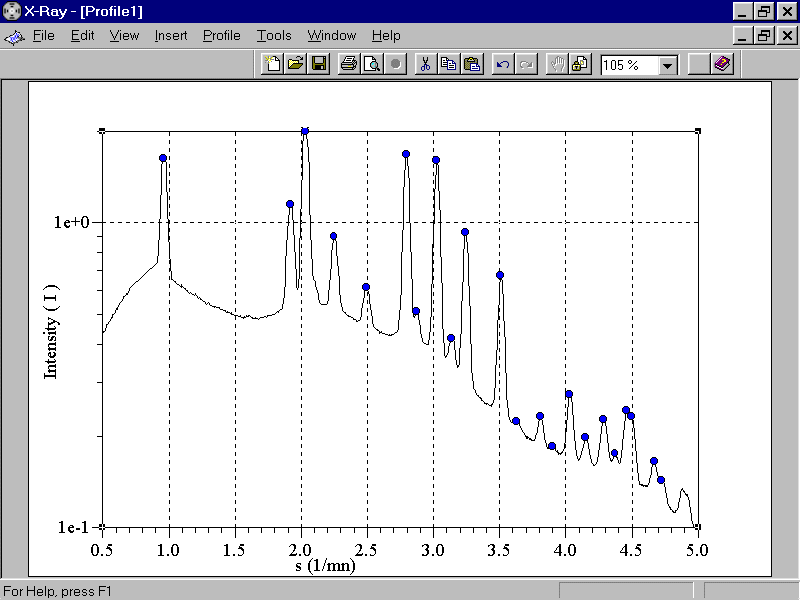
Then, profile looks like this :
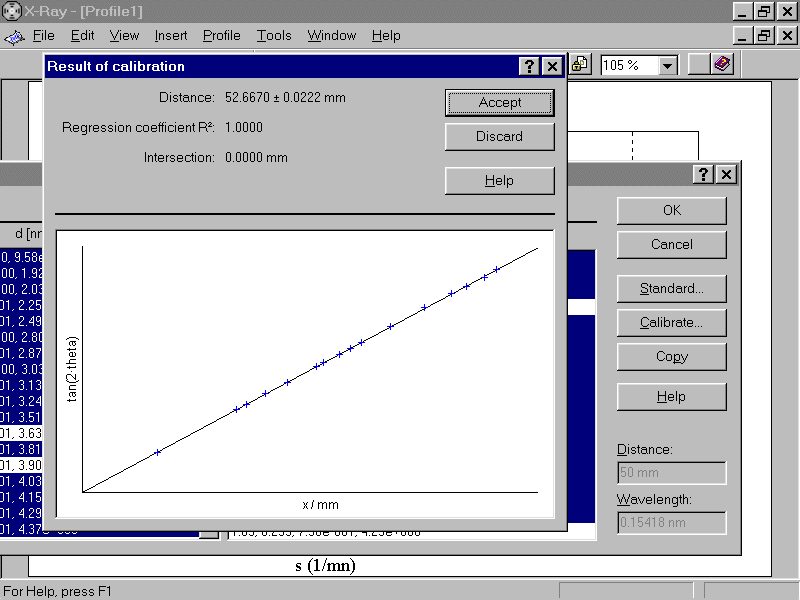
It is possible to compare the table of maxima with a standard table for the used conpound, selecting the corresponding maxima

As a result of the calibration procedure, the best linear relation is presented and the calculated sample to detector distance is proposed. User can accept or discard this value.
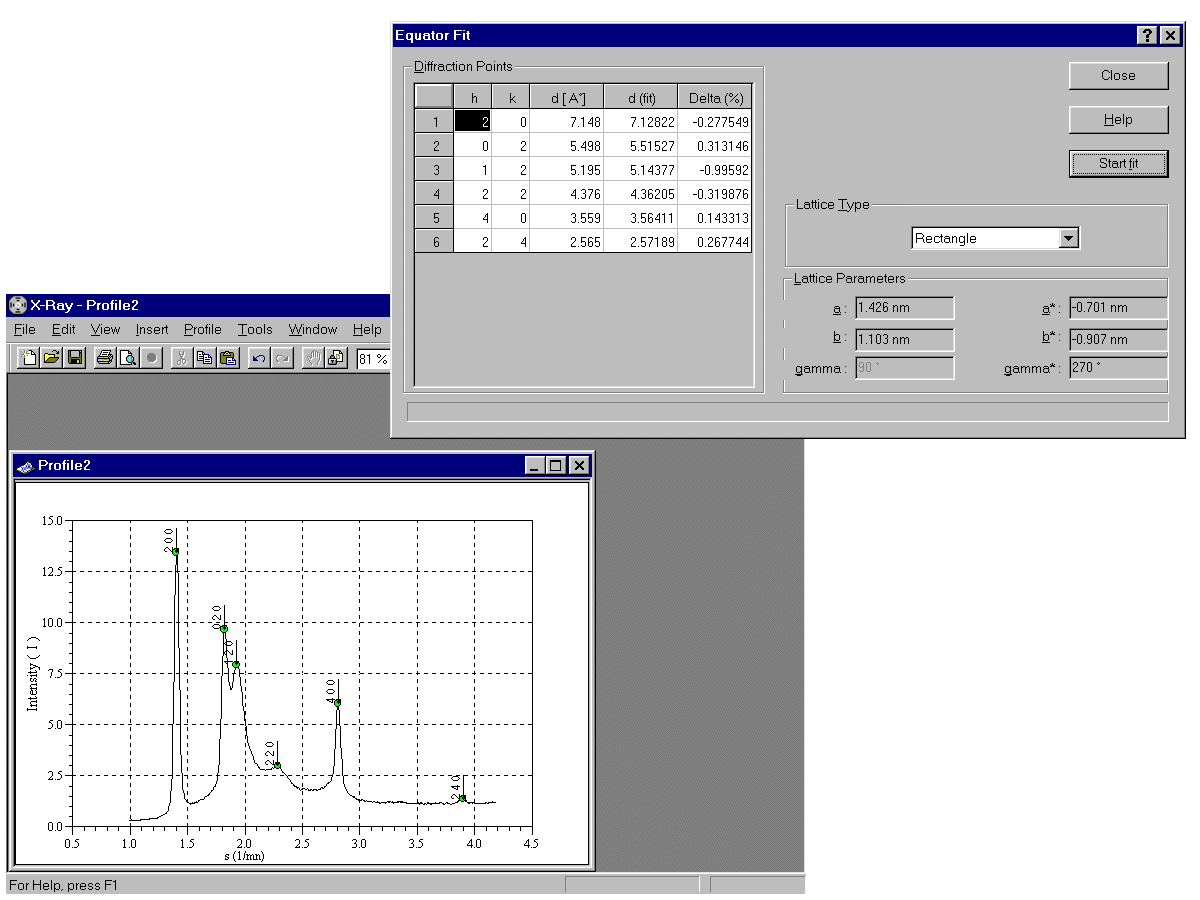
For other profiles, it is possible to attribute Miller indices to the peaks (i.e. a polyethylene sample)
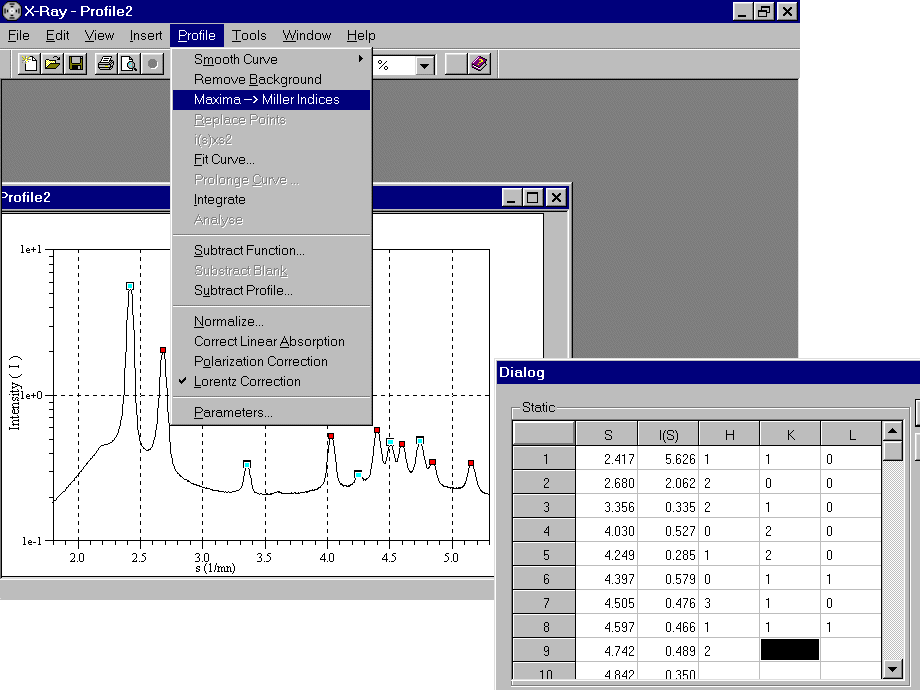
It is thus possible to realize a fit of the cristallographic parameters, assuming a particular symmetry system, by a least squares procedure.

If we want to characterize a polymer sample about its crystallinity, it is useful to separate the contributions due to the crystalline peaks and the background "amorphous" halo. It is possible to export the data for treatments by other software, but X-Ray includes also the definition of a background, and the possibility to integrate the profile (total intensity or background).

The most interesting capabilities of X-Ray concern the analysis of the diffraction pattern of oriented polymer samples. Among the specific parameters, it is possible to define the fiber axis orientation.
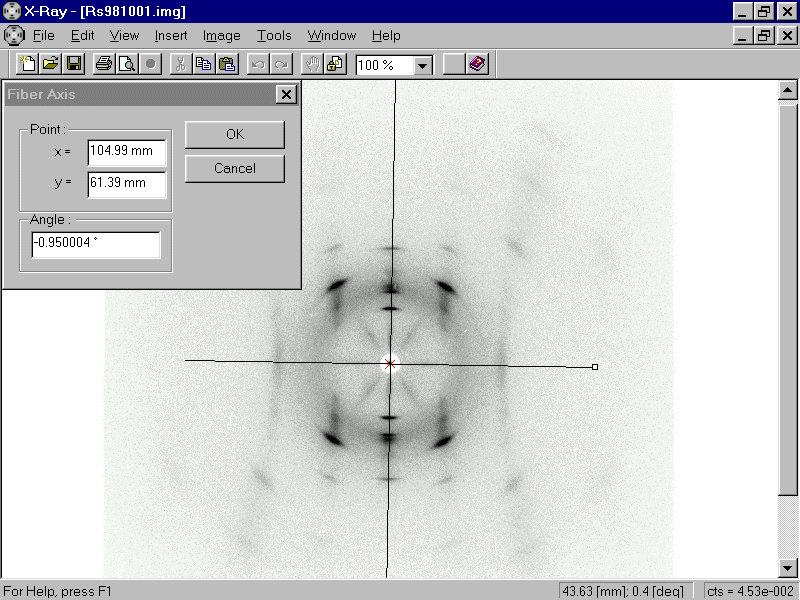
If the c crystallographic fiber period is known, it is possible to highligth the different lines. It is possible to analyse the equatorial spots alone by integration of the intensities in a sector. A magnifier is also included to identity close spots.
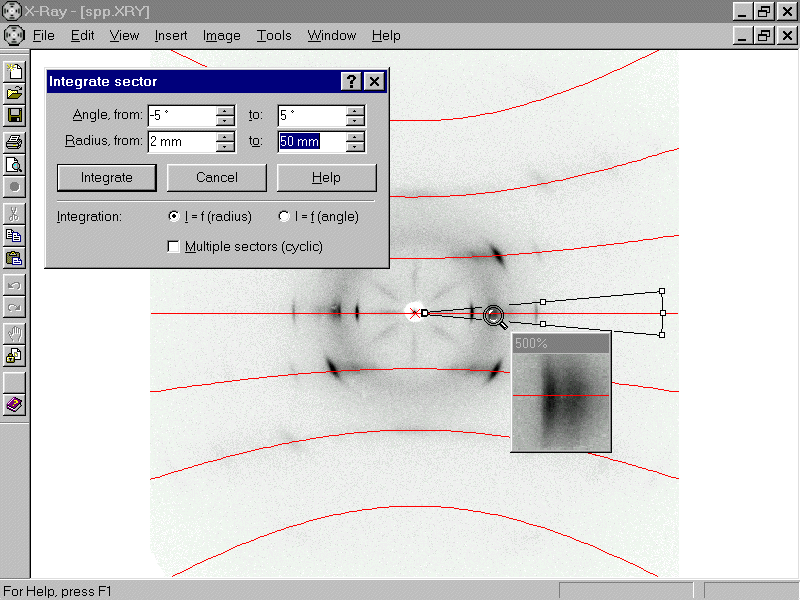
It is possible to realize a fit of the crystallographic a, b and g parameters from h and k Miller indices for equatorial diffractions.
