CCP14
Methods, Problems and Solutions - and Tutorials
GSAS (General Structure Analysis System) Rietveld powder diffraction and Single Crystal software
Generating a VRML based 3D Structure and Electron Density Contour Map in GSAS
The CCP14 Homepage is at http://www.ccp14.ac.uk
[The reference to use for GSAS in any resulting publications is:
A.C. Larson and R.B. Von Dreele, "General Structure Analysis System
(GSAS)", Los Alamos National Laboratory Report LAUR 86-748 (1994).]
This example uses the raw hkl data used to determine the crystal
structure of Cs2TiSi6O15
as published in I.E. Grey, R.S. Roth, M.L. Balmer,
Journal of Solid State Chemistry, 131, 38-42 (1997).
- GSAS comes with an inbuilt version of ORTEP and a 2D Fourier electron density
contour map viewer. However, the VRSTPLOT utility can generate 3D structure and 3D electron
density contour maps in VRML that can be viewed in any VRML viewer such as
Cosmo or
WorldView.
- This tutorial builds on the
Example Single Crystal Refinement in GSAS
and assumes you are at the stage of having a structure ready to perform a Fourier Map
generation to pass onto VRSTPLOT.
- NOTE: For generating fourier maps based on Powder Diffraction
data in GSAS (the following uses single crystal data) refer:
Generating and
Manipulating Fourier Maps from Powder Data in GSAS.
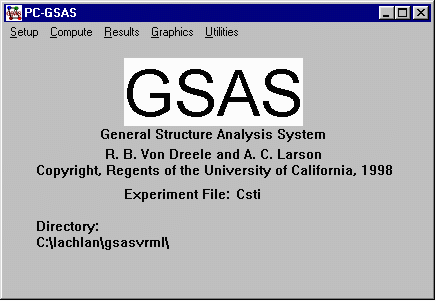
- Run GSAS for PC and load up the EXP control file using the Setup, Expname
option.
- The following example uses a DELF difference map.
Using the previous structure refinement tutorial as a guide, delete the
O7 and O8 atoms (which give abnormal thermals), set up GSAS to do
zero cycles, run GENLES. Now the two deleted Oxygens should be the
main peaks in the Fourier Difference Map.
- Another way to do this would be to set the FRAC (occupancy) of the O8 and O9 atoms
to zero; fixing all O8 and O9 parameters, then doing zero cycles of refinement. The
advantage of this is that the Oxygen atoms will still be present in the VRML file.
- The control of the refinement and setting up the
parameters for the fourier map is performed in the Expedt module
- Via the GSAS menu, select Setup, Expedt
- You are normally prompted whether you wish to make a backup, not make a backup file or
review a previous file. Normally Y for creating a backup is a good idea.
- Using the previous structure refinement tutorial as a guide, delete the
O7 and O8 atoms, set up GSAS to do zero cycles.
- At this point, enter F to enter Fourier calculation set up.
- When prompted select, DELF to set up a difference Fourier Map and
go for an X section.
- When prompted, select Y for individual map steps
and choose 0.1 for X, Y and Z. And we want to generate the map in the
range of 0 1 for X, 0 1 for Y and 0 1 for Z.
- When prompted, include Histogram 1 (as per the csti.hkl dataset
imported in the previous tutorial) by typing 1 0.
- Everything in the setup is now done so exit from EXPEDT by
typing X X
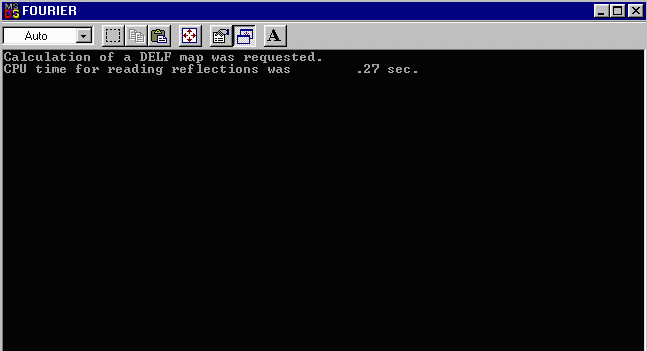
- From the main menu, run Compute, Fourier
- Now that the Fourier Map has been generated, enter Graphics, Vrstplot to
generate the VRML file.
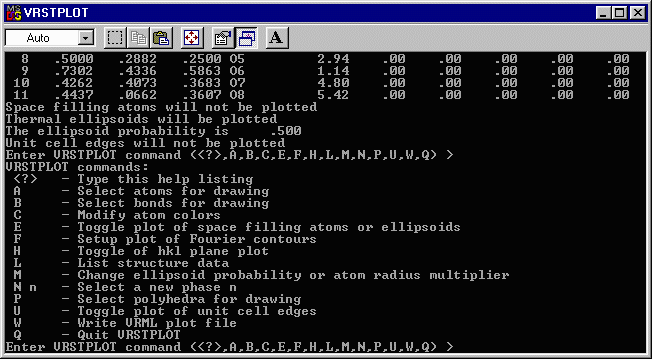
- To tell Vrstplot to use the Fourier Map, enter F
- Enter a suitable contour Level (a few trials may
be required here): C 0.4
- Enter a suitable grid spacing (a few trials may
be required here): G 0.25
- Doing a list will tell you the status: L
 X     - Exit Fourier map controls
Enter Fourier plot command (<?>,C,F,G,L,M,R,X) >l
Selected map type is DELF
The map values range from   -1.02 to   3.53 with a scaling factor of  1.E+01
Contour will be drawn at:    .30000
The map grid interval is   .25 A
The range in X to be contoured is from   .00 to  1.00
The range in Y to be contoured is from   .00 to  1.00
The range in Z to be contoured is from   .00 to  1.00
Fourier map contour will be plotted
- When happy, go back to the Vrstplot main menu: X
- Toggling the UNITCELL axes on using the U command
can be a good option.
- You can now add atoms or bonds by using the A and/or
B options.
- If you want to plot all the atoms, under A, select
U, then define all the atoms (13 atoms -> 1:13)
- (For bonds, a bond diameter of 0.01 can be good under
most cercumstances)
- At the main menu select W to write the VRML
file. When prompted choose a colour for the background (11 is a good
option - try it).
Then open up the VRML file using your favourite web-browser with
VRML viewer installed. While Vrstplot is still running, you can
re-write files and reopen them in the browser (using the refresh
command) until you get the desired "look" for your output.
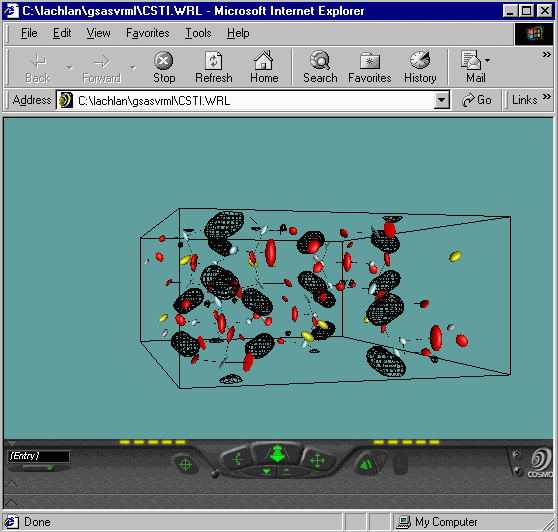
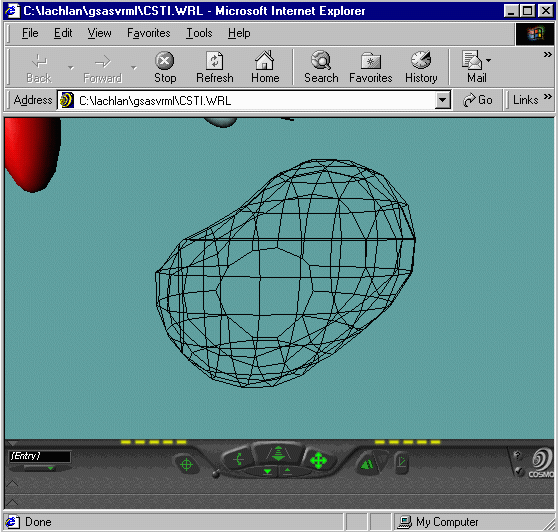
- You will note for the bottom VRML that you can make
out Peanut shaped Fourier Contours for the Oxygens - implying a split
atom problem. Plus you can zoom around your structure and fourier map
using the VRML viewer.
- (It is possible to manually edit the VRML file and
change the properties of the VRML (translucent glass look for the
contour maps, etc)
- Click here to download the Generated VRML Atom and Fourier Contour map file.
